2.1 Bin Size Calculation - Receiver and Source Station Intervals
In a nutshell, a shot record (shot gather) is a sampling of a wavefield coming from the subsurface in time and space.
In time, the wavefield is sampled (for example) every 2 ms. In space, the wavefield is sampled at every receiver station interval. (e.g., 20 meters). So, a correct receiver station interval should get the required bed resolution for the geologic targets and their correct dip in the subsurface. Also, proper spatial sampling of the strongest coherent noises in the area will be convenient for good attenuation during processing.
Dimensional Sampling
In a 2D seismic survey, the spatial sampling is done along one single receiver line in only one direction. In a 3D case, the spatial sampling is extended to all directions because several receiver lines record the seismic reflections.
The Shannon-Nyquist Theorem
For calculating the bin size It is a formula based on the Shanon-Nyquist sampling theorem to avoid aliasing:
Where Variable Metrics Represent:
- B = Bin size
- V = Interval velocity to the target.*
- F = Maximum frequency to get recovered.
- Ɵ = dip of the target.
Velocity Estimation Challenges & Calibration
*As usual in geophysics, proper velocity estimation could be difficult. Some authors claim to use the interval velocity to the target provided by sonic logs. However, this value is usually higher than the velocity of seismic waves propagating from the surface to the target, producing an overestimated bin size calculation.
The sensible approach we used is to calibrate the sonic logs with the check shots existing in the area and calculate a linear function from them. In that case, we can get a V(Z) representing the area to be surveyed. (Liner, 2000). Velocities from sonic logs are usually higher than seismic velocities due to the higher frequency of the measurement. This calibration can adjust the velocity values for a proper bin calculation.
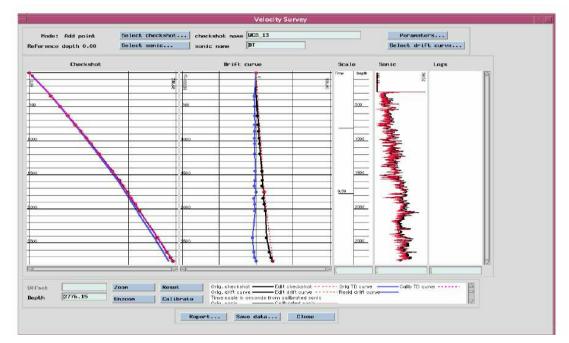
Fig. 1 Sonic log and check shot calibration. Velocities from sonic logs are usually higher than seismic velocities due to the higher frequency of the measurement.
Resolution Criteria & Symmetric Targets
Having the bed resolution requirement for the geological target and taking into consideration the Raleigh criteria (λ/4), we know the theoretical frequency to be recovered and then the bin size to be selected from the graph. For geological targets with gentle dips, it is recommended to take a dip of 30° for bin size calculation to collapse at least 95% of diffracted energy during migration. (V Vermeer 1990). Additional analysis of previous seismic data (raw and processed data) is recommended to know the maximum frequencies recovered in the area previously.
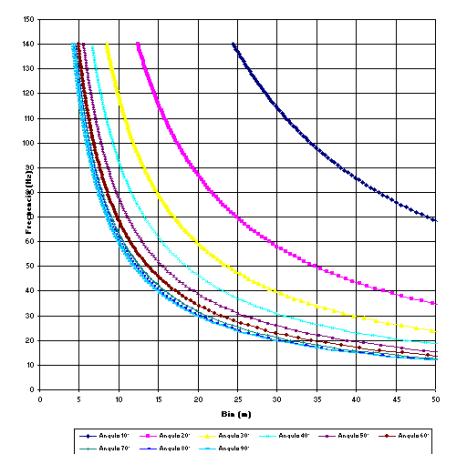
Fig. 2 Bin size vs maximum frequency to be recovered for all dips.
It is well documented the advantages of having a symmetric bin size (Vermeer 1990). Having that in mind, we can define the following: Bin size (in the inline direction – target structure dip direction) = Bin size (in the x-line direction – target structure strike direction). For example, a bin size of 15x15 or 20x20. By definition, the receiver station interval is 2x the inline bin, and the source station interval is 2x the x-line bin. From the previous example: Receiver station interval = 30m or 40m. Source station interval = 30m or 40m. In a 2D case, the inline bin size will be the distance to use (CMP distance) along the 2D line, and the fold of coverage to be desired will define the source station interval.
Spatial Sampling Requirements
Depending on the seismic survey requirements, sometimes the bin size is calculated having in mind a proper spatial sampling for the signal and all coherent noises in the area (full wave sampling).
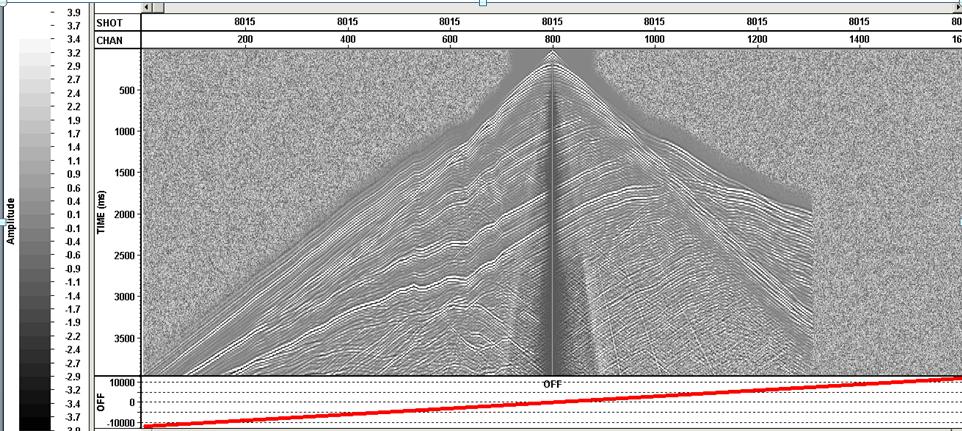
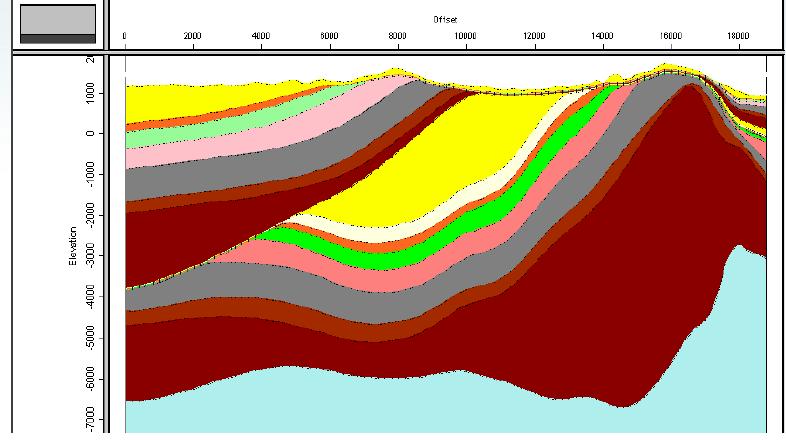
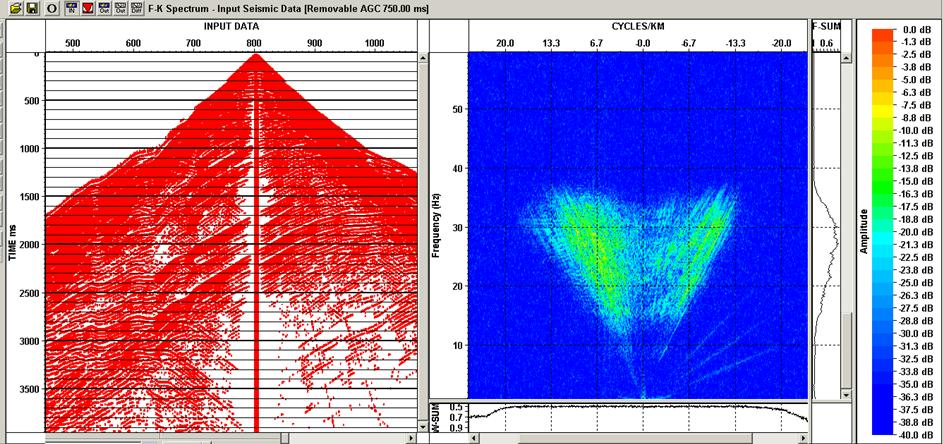
In this real 2D case, the CMP distance was obtained from velocity models of the area to be surveyed, and synthetic shot-gathers were produced with different receiver intervals (GI) using Elastic Wave Equation Modelling (EWE) and further F-K analysis to check the spatial aliasing of all wavelengths in the synthetic shot records. For GI =10m, the F-K analysis does not show any spatial aliasing for all wavelengths. With a similar approach, sometimes it is sensible to make a 3D velocity modelling and then extract a 2D profile to make the EWE modelling and do the F-K analysis to calculate a proper 2D receiver station interval.
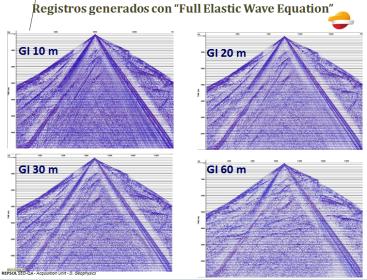
Fig. 3 Synthetic shot gathers from EWE Modelling with different receiver station intervals (GI).
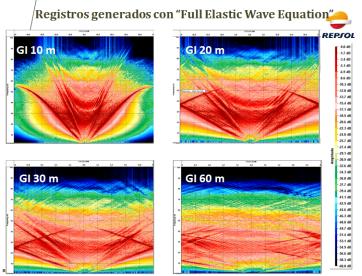
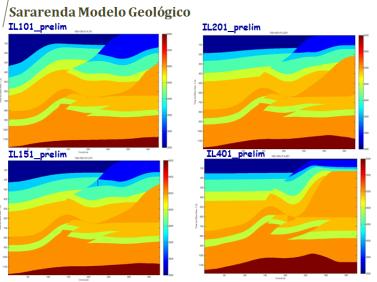
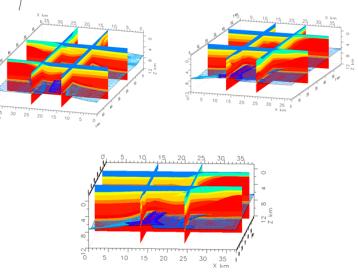
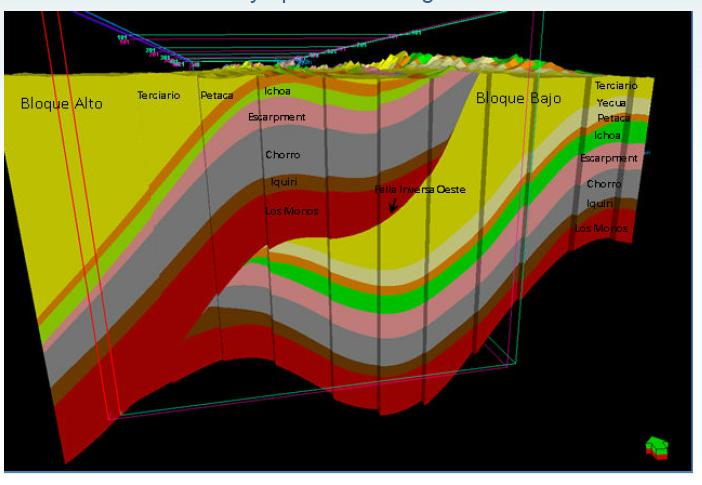
Fig. 4 (a) 3D geo-cellular velocity model from Petrel. (b) 2D Profile from 3D model. (c) EWE shot-gather modelling (GI=15m and max offset = 12km – asymmetry due to model extension). (d) F-K analysis shows no spatial aliasing for all wavelengths.