
2.2 Sweep Parameter Testing
The design of sweep parameters is a trade-off (compromise) between operational efficiency and the quality of the recorded (raw) seismic data.

Figure 11. Peak Force during 16-S Sweep length. (Radio Similarity Test). From Mexico Project.
The main sweep parameters to test are:
- Sweep length.
- Number of vibrators.
- Number of sweeps.
- Frequency range ( Bandwidth ).
- Drive Level.
- Sweep Type.
- Taper.
Occasionally, some parameters are already defined on the contract such as number of vibrators per (source) array and number of fleets. Sometimes source array length is also tested. It is essential to investigate whether previous seismic surveys have been conducted within or near the project area. The acquisition parameters used in these earlier projects can provide valuable reference information and help support the selection and optimization of parameter tests for a new survey.
From seismic data quality point of view, the evaluation of S/N ratio and recovered bandwidth are the main subjects to evaluate. Let’s see some examples:
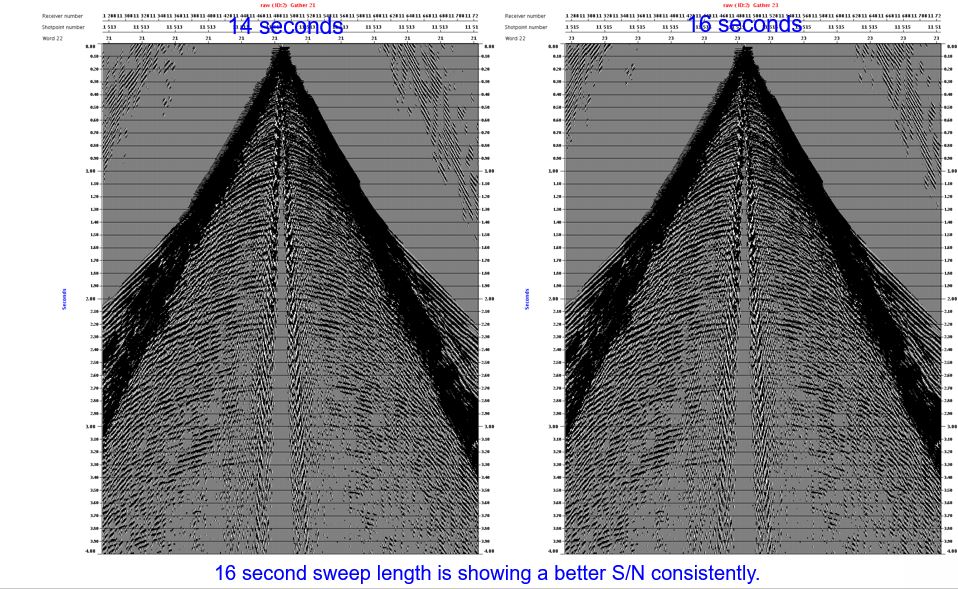
Figure 2. Sweep length test. 16s-sweep length shows a better signal to noise ratio than 14s-sweep shot gather.
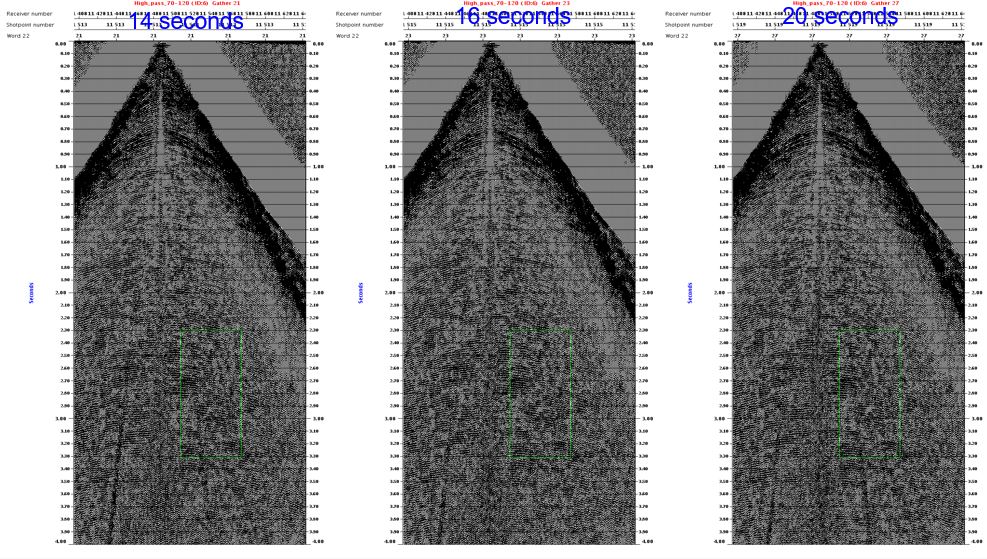
Figure 3. High-pass filter (70-120 Hz) analysis of shot gathers acquired with three different sweep lengths. The filtered frequency panels facilitate the evaluation of signal recovery within specific frequency bands and enable comparison of the effectiveness of different sweep parameters.

Figure 4. Number of vibrators in (source) array. It is quite clear the increase of the S/N with the number of vibrators.

Figure 5. Number of vibrator parameter test. The black curve (source array of four vibrators) shows a bigger amplitude on the frequency range of interest.

Figure 6. Number of Sweeps parameter test. The two shot gathers have a similar S/N. By choosing one sweep (no vertical stack) we will get more efficiency on the operation.
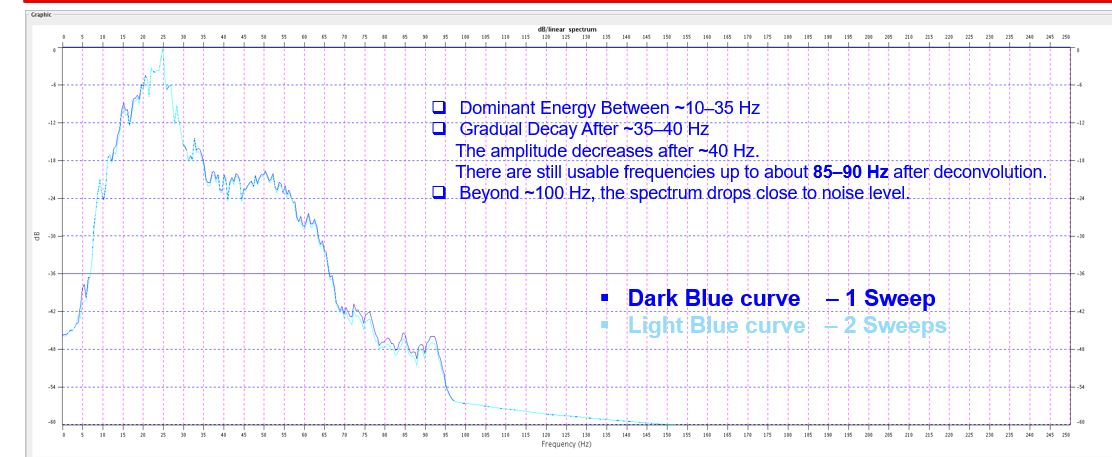
Figure 7. Number of sweeps parameter test. Amplitude spectrum. One sweep versus two sweeps parameter. They show a very similar response for the frequency range.
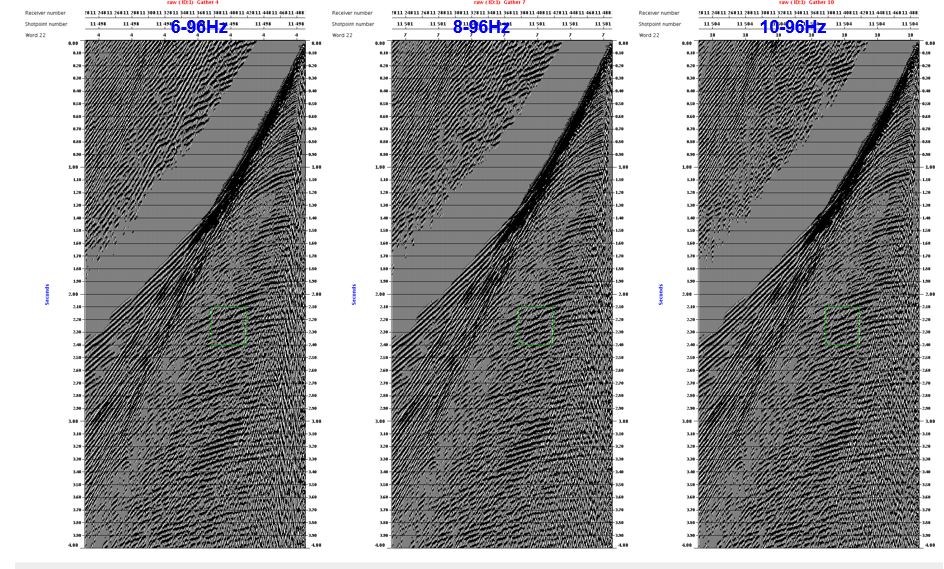
Figure 8. Bandwidth (Frequency range) test. The three shot-gathers show a very similar S/N. In theory, a wider bandwidth will give us better seismic (vertical) resolution. (The range 6-96 Hz spans 4 octaves).
Figure 9. Bandwidth Parameter test. The Sweep 6-96 Hz (blue curve) shows a slightly bigger amplitude near the dominant frequency.

In Vibroseis jargon, drive level is the percentage of the hydraulic peak force (HPF) delivered by the vibrator during the sweep. For example, the Sercel Nomad 65 Neo vibrator has an HPF of 27,724 daN (daN = decanewton). For safety reasons, Sercel typically applies a maximum of 90% of the HPF (~24,951 daN). If a drive level of 75% is used, the actual Peak Force delivered on each sweep would be approximately 18,713 daN.

Figure 11. Peak Force during 16-S Sweep length. (Radio Similarity Test). From Iraq Project.
It is well understood that increasing the Drive level % generally leads to higher harmonic distortions. A larger % has more demand on the servo-control mechanism and actuator, resulting in increased system nonlinearities. These bigger nonlinearities generate higher-amplitude harmonic components in the output signal.

Figure 12. % of Drive level parameter test. The 75% drive level (blue curve) delivers more energy on the frequency range of interest.
It is a good moment to introduce some general rules accepted on vibroseis parameter evaluation:

Figure 13. General rules (not absolutes in geophysics) accepted regarding the S/N of seismic data and sweep parameters. (Modified from Mustagh Resources. Mustagh.com).

Fig. 14. The signal-to-random-noise ratio of seismic data is directly related to the number of sweeps according to a square-root relationship. (Modified from Mustagh Resources. Mustagh.com).
Sweep Type: Depending on the geological objectives, it may be necessary to emphasize a particular frequency range within the sweep. In such cases, nonlinear sweep designs can be tested by allocating more time or energy to selected frequencies. Low-frequency emphasis is often used for deep targets to enhance penetration, while high-frequency emphasis may be applied to partially compensate for earth attenuation and improve vertical resolution.
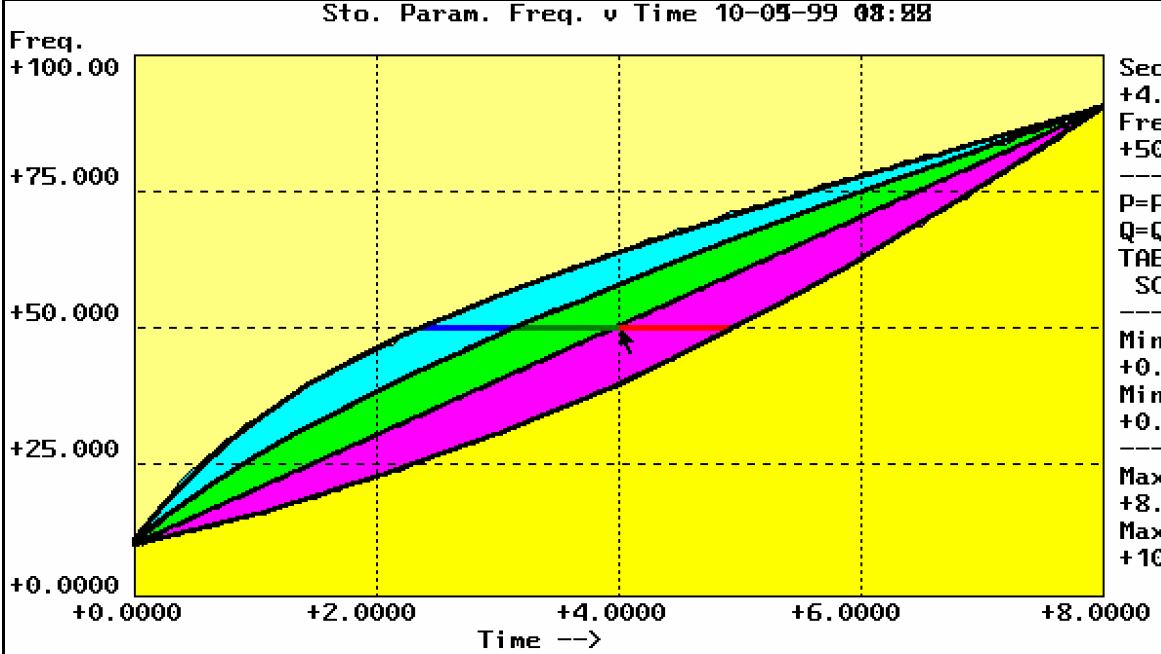
Figure 15. Comparison of linear and nonlinear sweep designs. The nonlinear sweeps shown in cyan, green, and magenta correspond to +6 dB/octave, +3 dB/octave, linear, and −3 dB/octave, respectively. Although each sweep contains the same bandwidth, the frequencies are generated at different times and with different energy distributions. (Modified from Mustagh Resources. Mustagh.com).

Figure 16. Amplitude Spectra from linear, + 3dB/Oct and +6 dB/Oct. sweeps. They show different levels of emphasis across specific frequency ranges. (Modified from Mustagh Resources. Mustagh.com).
Taper parameter testing: The taper is a square cosine function applied at the start and end of the sweep to enhance vibrator performance. Its main benefits include reducing correlation sidelobes, minimizing harmonic distortion, mitigating Gibbs effects, and helping the vibrator in the decoupling of the baseplate from the ground.

Figure 17. Amplitude and phase spectra for a sweep with 4 ms taper ( almost no taper ) applied. Note the strong Gibbs effect and ringing sidelobes on the wavelet. (Modified from Mustagh Resources. Mustagh.com).
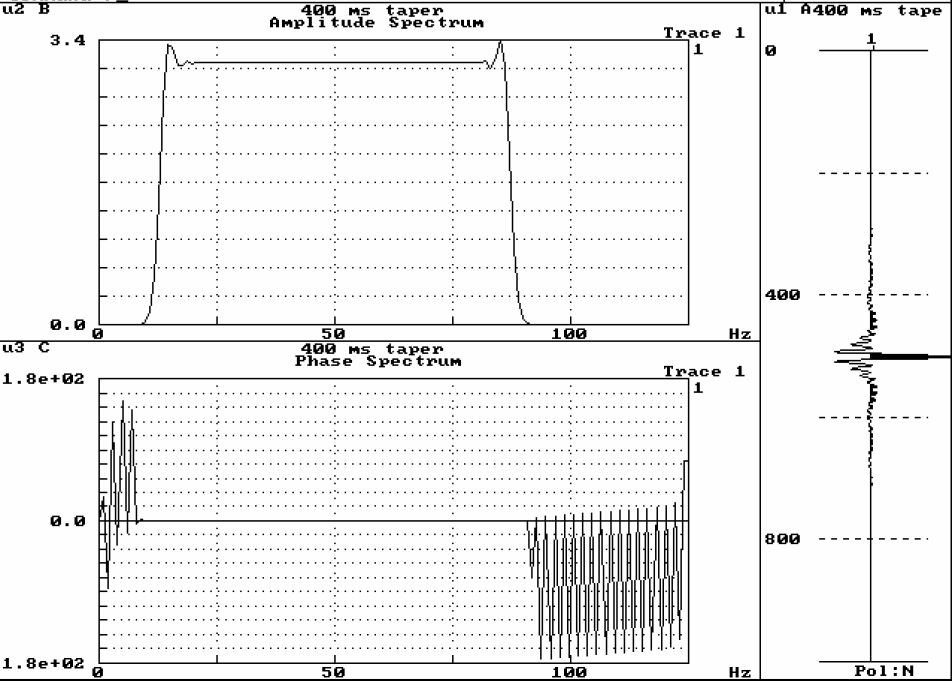
Figure 18. Amplitude and phase spectra for a sweep with 400 ms taper applied. Note the reduction of the Gibbs effect on the amplitude spectrum and ringing on the side lobes of the wavelet.
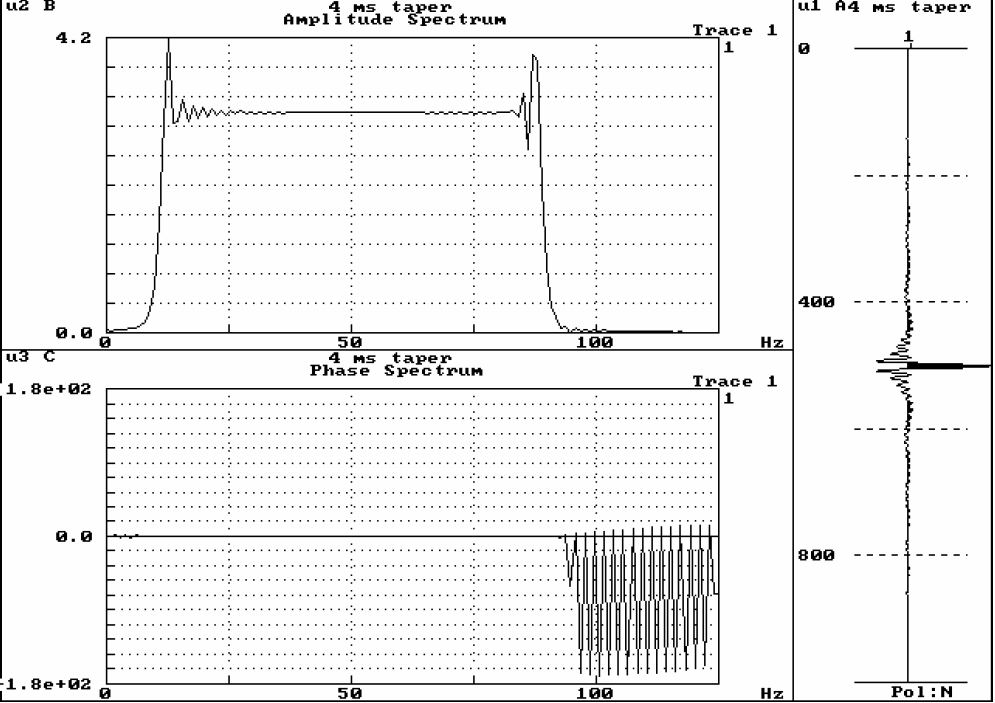
Figure 19. Amplitude and phase spectra for a sweep with 1000 ms taper applied. A too long taper will reduce the energy ( amplitude ) delivered by the sweep also reducing its effective bandwidth. (Modified from Mustagh Resources. Mustagh.com).
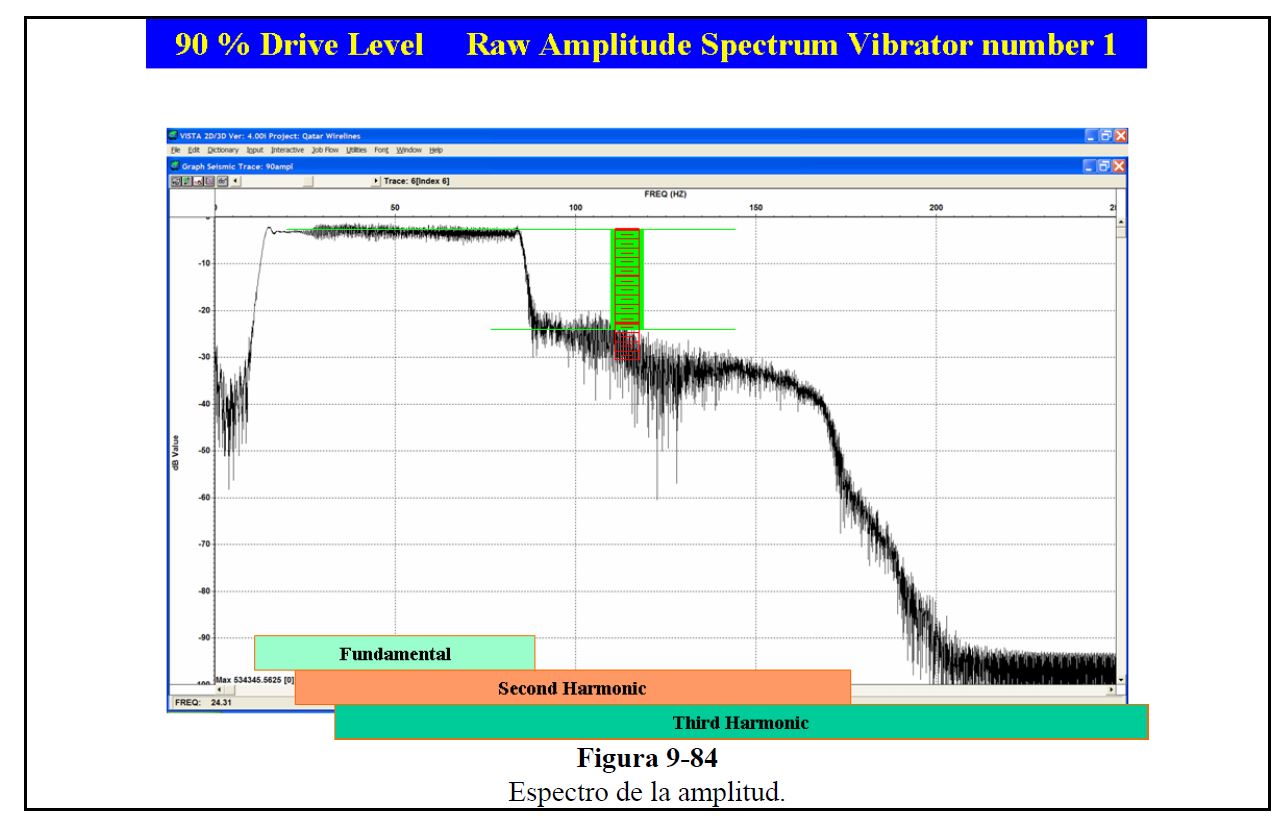
Figure 20. Amplitude Spectrum for raw seismic data from a sweep with 90% of drive level. Note the amplitudes for higher frequencies than the fundamental (pilot sweep) due to harmonics. (Modified from Mustagh Resources. Mustagh.com).
An example of compromise in the selection sweep parameters: The next figures show a compromise on the sweep parameter selection. Comparison between two shot-gathers with 70% and 75% drive level. They have almost the same S/N. However, 75% Drive level shows bigger values of average and peak distortion. (For the same point vibrating more than 100 times).


Figure 21. Comparison of Average Distortion and Peak Distortion for 70% (above) and 75% Drive level (below). The same point was vibrated more than 100 times (test line).
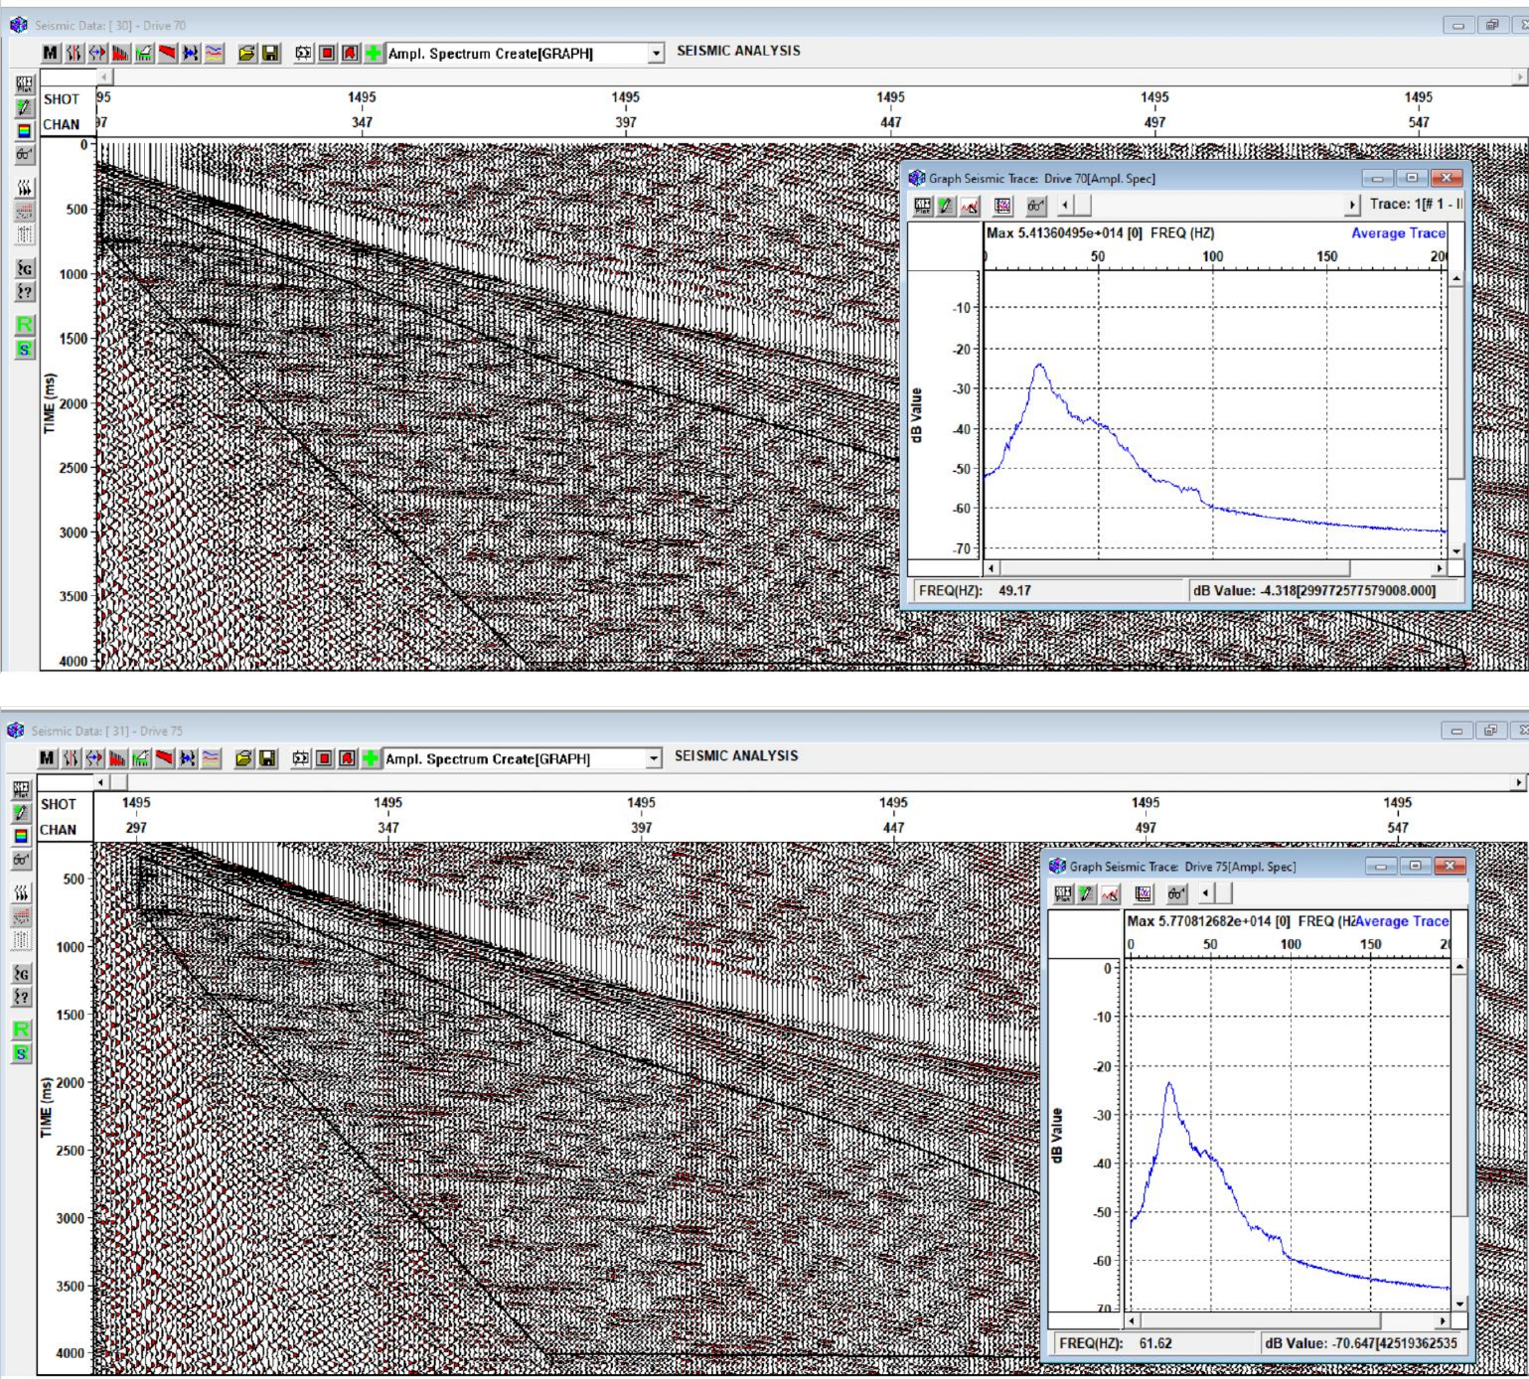
Figure 22. Two shots gather with the two different Drive levels. Their S/N and amplitude spectra (on same window) are very similar.
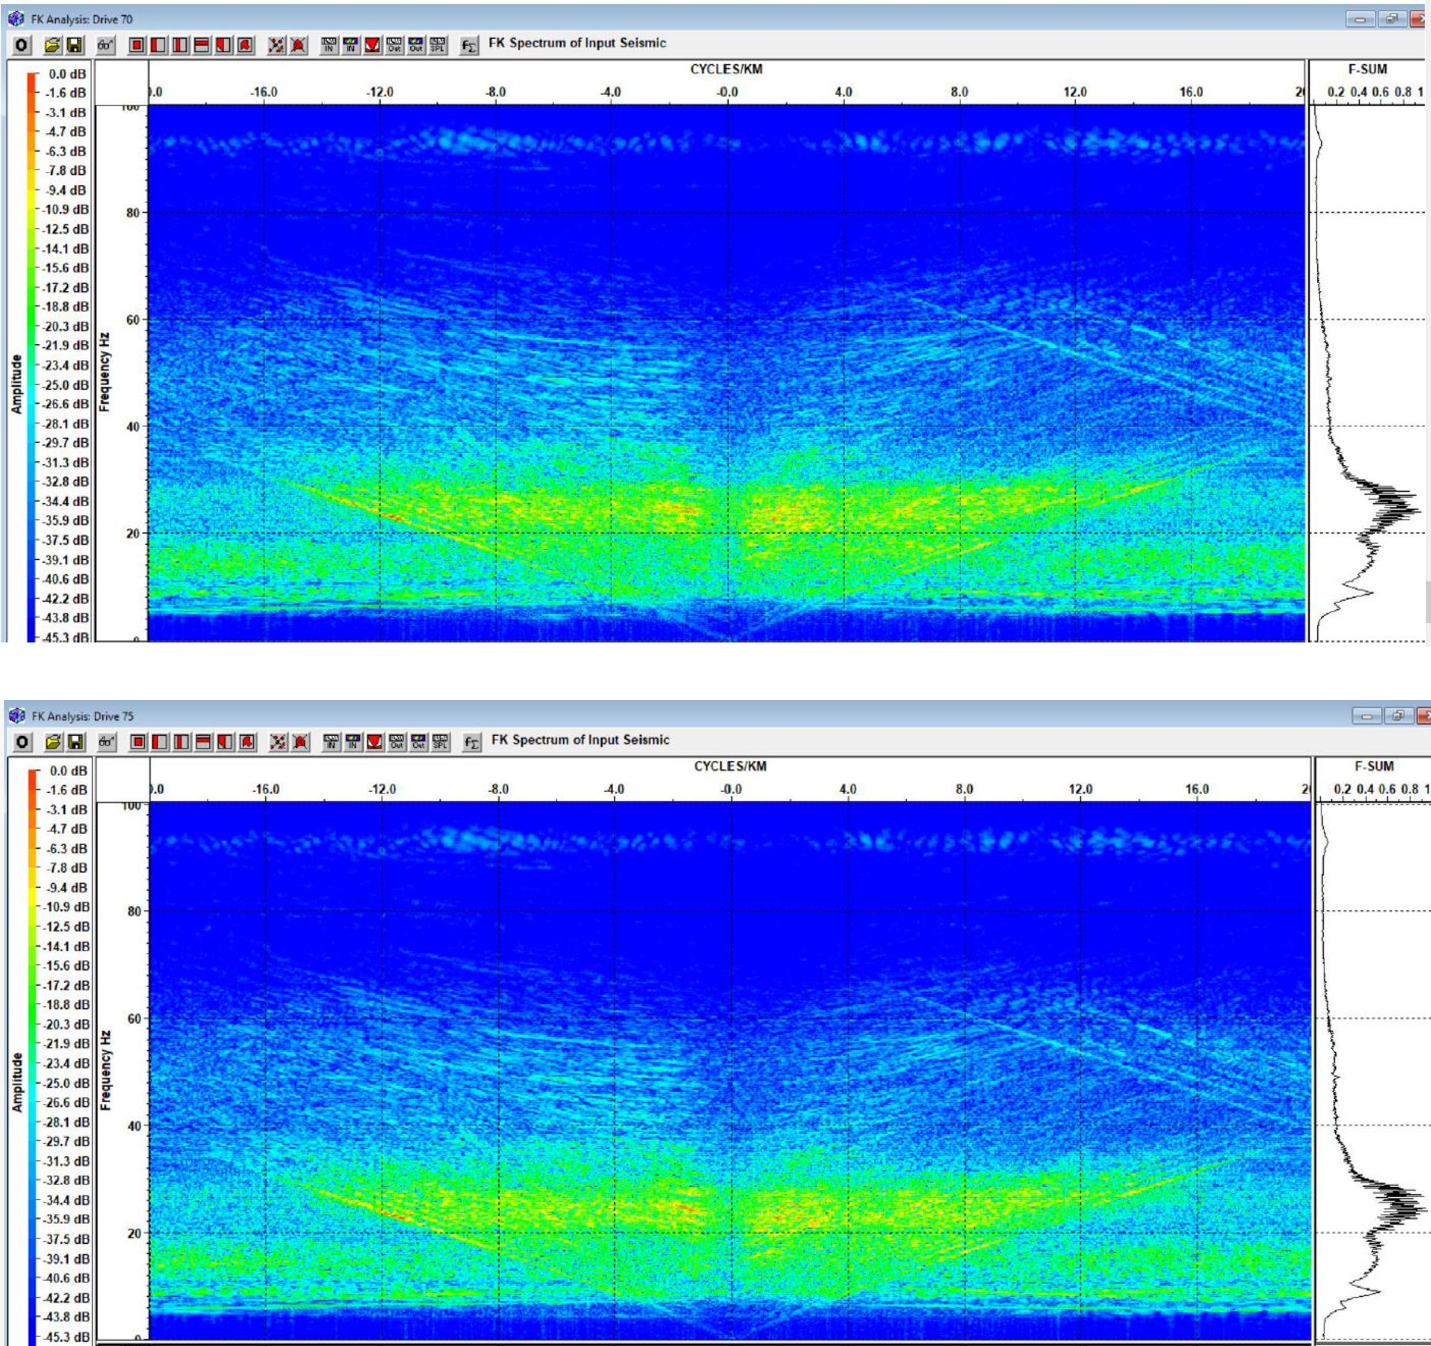
Figure 23. F-K displays for the two shot-gathers from above. The signal and noise amplitudes and frequency content for both seismic records are very similar. Making the best parameter selection the drive level which produces less distortion.