2.10 Wide-Line profile
There is a seismic acquisition technique called wide-line profile. Basically, it is a 2D line designed with inline and xline fold components and side-scattering noise attenuation.
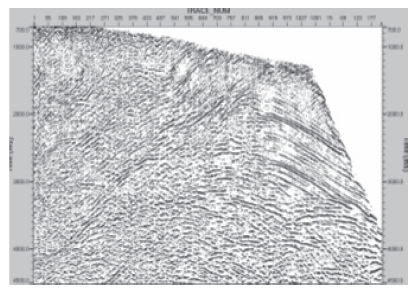
In areas with a very low S/N due to near-surface and subsurface complex conditions, there are strong side scattered interference noises which mask the reflected signal from geological targets. The interfaces between fractured cliffs and the air have a strong acoustic impedance contrast, producing side scattering noises during wave propagation. Additionally, variations in the weathered thickness introduce complex statics problems in seismic imaging. Typical shot gathered in this area has a very low S/N, such as in the YingXiongling area in the North-West of China, which is a very complex area where the Wide-line profile technique has been applied successfully.
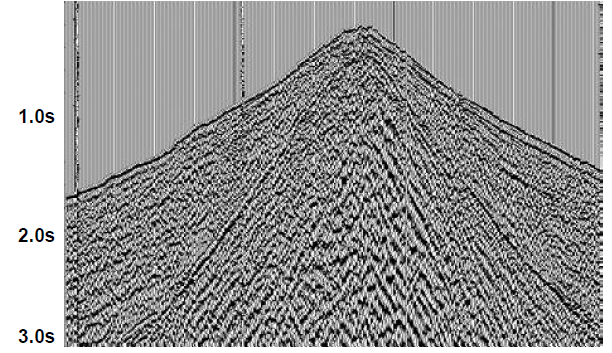
Fig. 1 (a) YingXiongling area in the North-West of China, a very complex area where the Wide-line profile technique has been applied successfully. (b) Typical shot gathered in this area has a very low S/N.
Side Scattering Attenuation Mechanics
The wide line profile technique can also be designed with receiver arrays in both inline and xline directions getting side scattering noises recorded in all directions. Similar frequencies, wavenumbers and different apparent velocities will help seismic processing for an effective attenuation.
Fold and Number of Receiver Lines
The designed fold of coverage depends on how many times you want to increase the S/N of the seismic image. In a Wide-line technique the fold can be increased n-times the number of receiver lines. That means we will have CMPs covering along inline and xline directions. These differences in the wave propagation paths within the bins (CMP gathers) can erode the coherence of the interference noises while increasing the ability of suppression by a high fold.
- F = Total fold
- n = number of receiver lines deployed
- m = number of source lines deployed
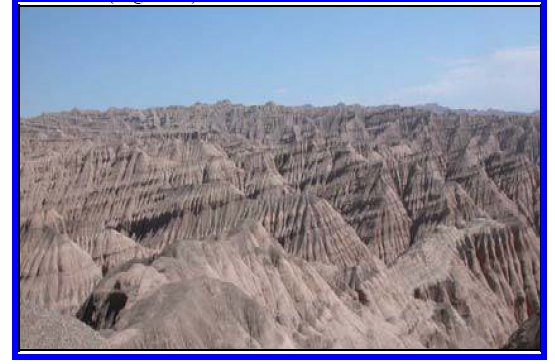
Fig. 2 Stacked sections: (a) 2D “conventional” geometry (1 RL and 1 SL). (b) Wide-line geometry (2 RL and 2 SL). (c) Wide-line geometry (3 RL and 3 SL).
Receiver Line Intervals and Receiver Array Length
In order to get symmetry properties, it is convenient to define the Receiver Line Interval as the same as the receiver array length (geophone-continue array). This interval “D” has to be equal or greater to the maximum wavelength (λmax) of the interference noise to be attenuated in the inline direction:
All that means is that for every receiver station on every receiver line, you have to deploy receiver arrays along inline and xline directions. This represents a gigantic fieldwork!
Wide Line Geometry Field Configuration Example
A real-world design configuration framework demonstrates the structural blueprint layout and spacing patterns required for continuous field execution components.
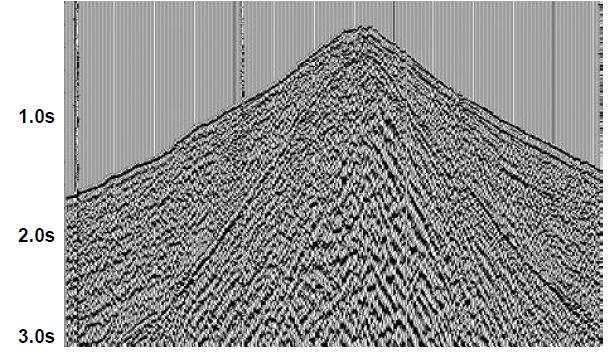
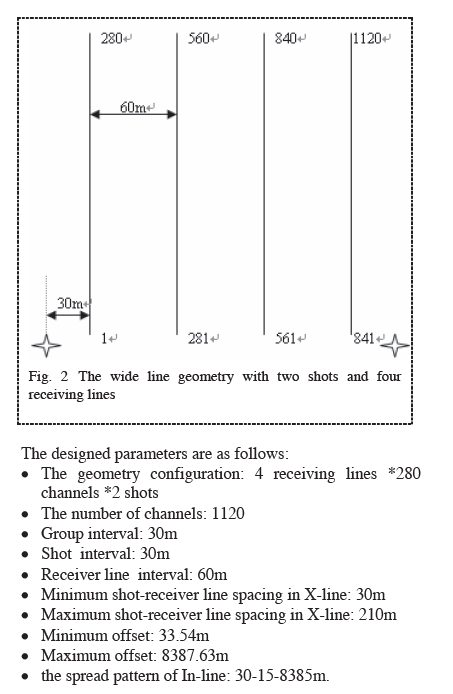
Fig. 3 Schematic display mapping out a structural wide line configuration layout featuring two distinct shot positions firing into a four-receiving line matrix array.
The designed parameters are as follows:
- The geometry configuration: 4 receiving lines * 280 channels * 2 shots
- The number of channels: 1120
- Group interval: 30m
- Shot interval: 30m
- Receiver line interval: 60m
- Minimum shot-receiver line spacing in X-line: 30m
- Maximum shot-receiver line spacing in X-line: 210m
- Minimum offset: 33.54m
- Maximum offset: 8387.63m
- The spread pattern of In-line: 30-15-8385m.
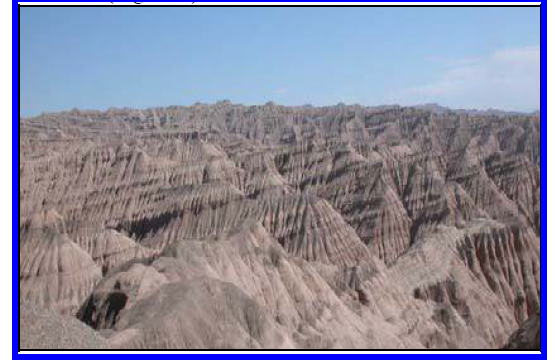
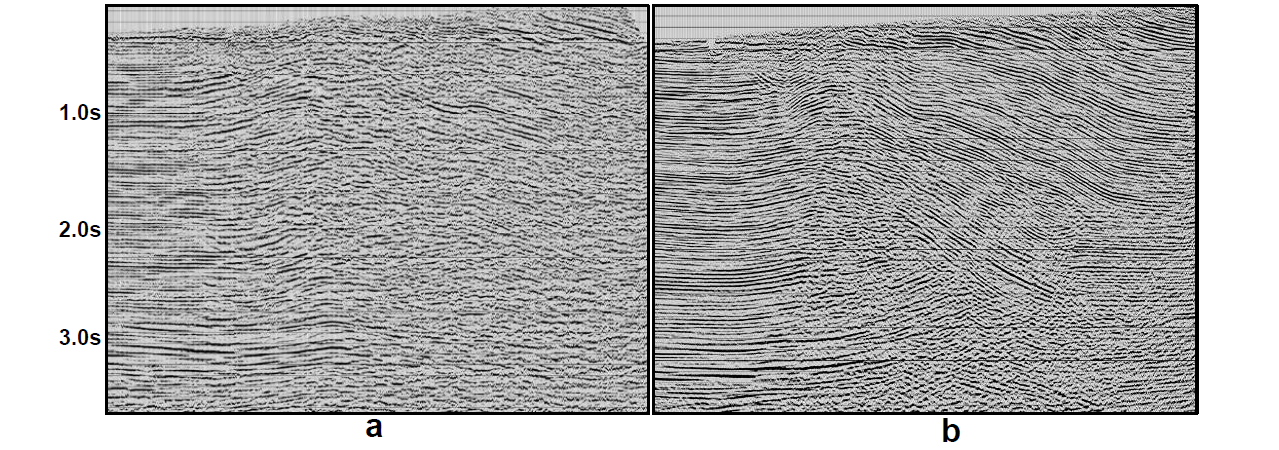
Fig. 4 Migrated Sections: (a) Wide-line geometry with discontinuous receiver arrays. (b) Same Wide line geometry in (a) but using continuous array in both directions.
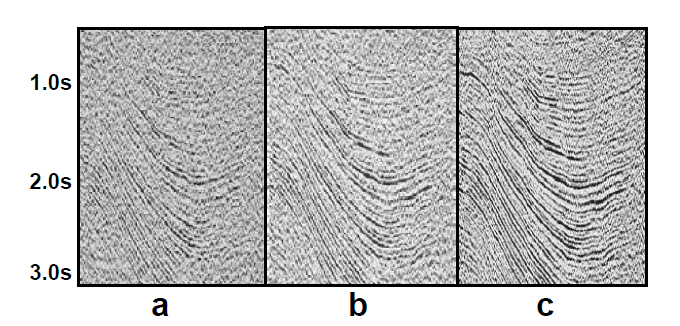
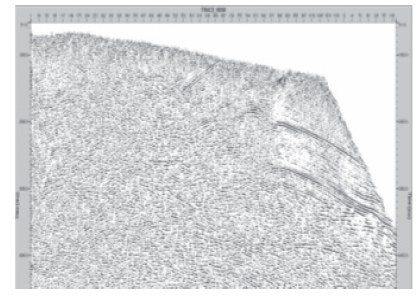
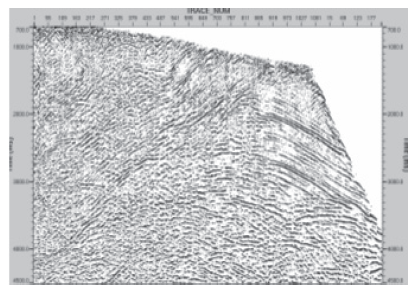
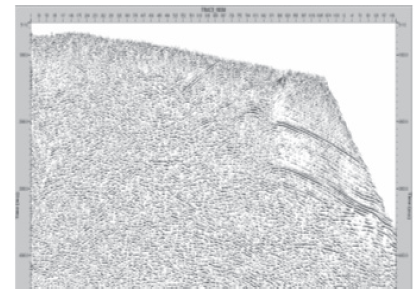
Fig. 5 Wide Line Acquisition Case for Overthrust Nappe Structure of Kulong Mountain in Jiuquan Basin, China. The Seismic Section (up) is a 2D single geometry. The Seismic section (down) is the wide-line geometry described above for the same area.
Technological Quality Evolution
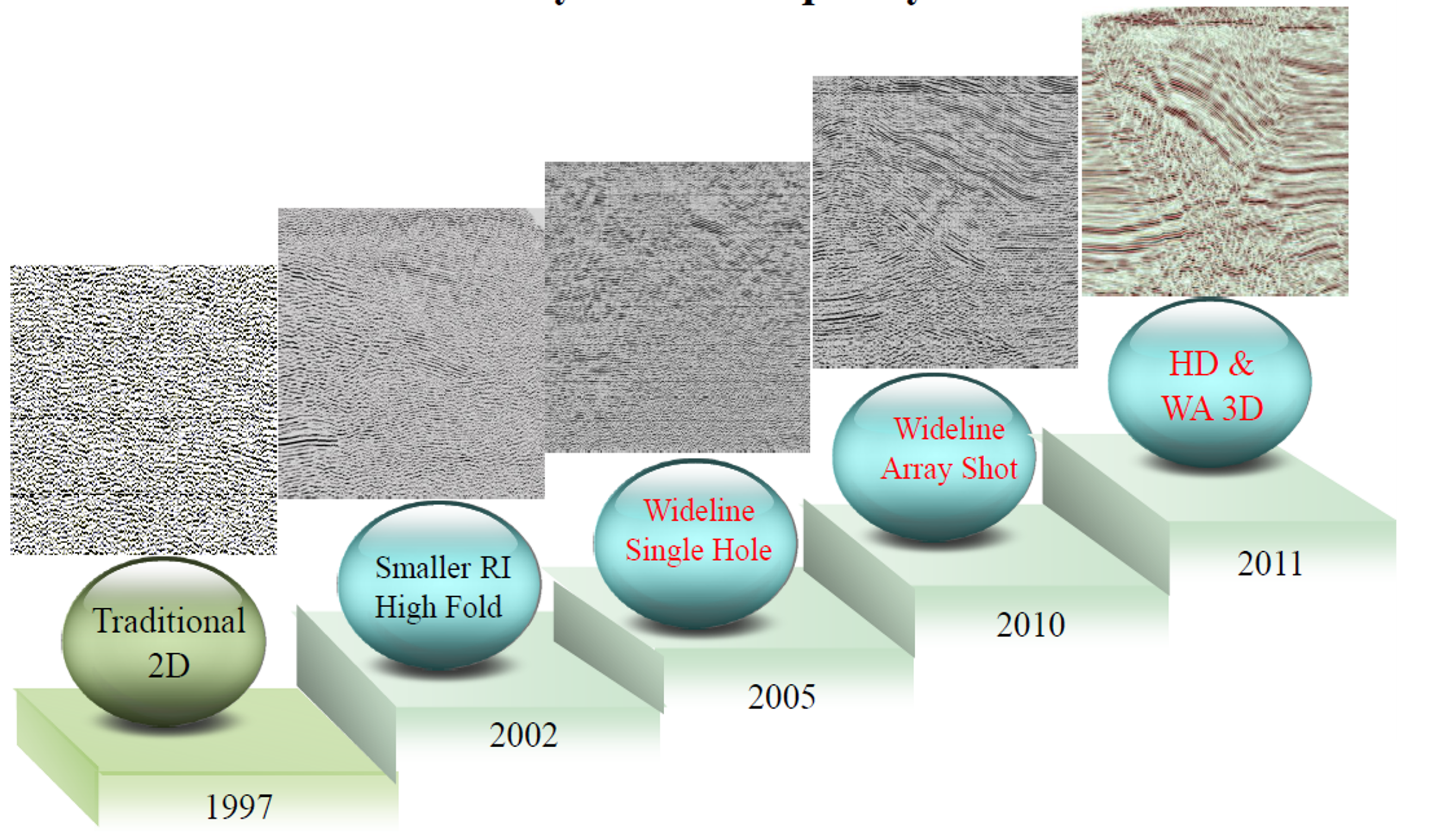
The historic evolution profile across complex basin developments validates how progressing step-by-step from narrow, lower-fold profiles to continuous array configurations drastically clears side scattered noise interference paths.
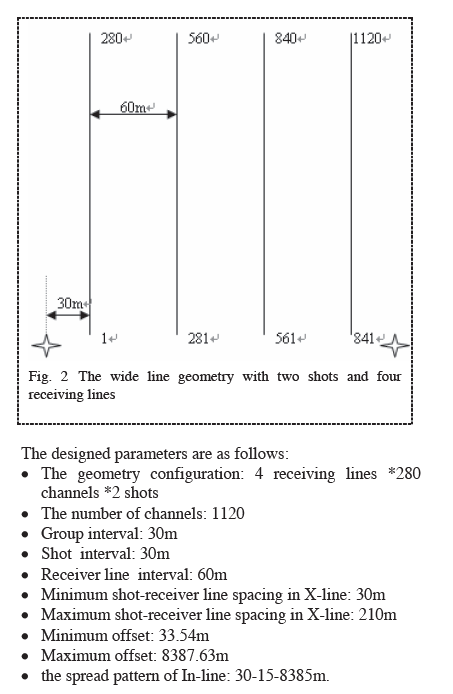
Fig. 6 Evolution of the Seismic Data Quality in Yingdong Oilfield in Western Qaidam Basin - China, detailing successive resolution milestones from 1997 up through high-density wide-azimuth 3D architectures.
Supplementary Calibration Profiles
The following supplementary diagnostic profiles illustrate structural calibration elements and continuous testing traces evaluated during geometry verification processing.